


Step 3: Write an Appropriate Description, cont.
Example 1: A Graph Provided for an Illustrative Purpose
Your book includes the following graph. It is a book on quantitative research methods, and the graph is provided in an introductory chapter that describes the different types of visual ways to present data. The actual data in the graph is unimportant. What is important is that it demonstrates how a large volume of data may be provided in the form of a line graph.
Source: Miles B. Livingston, Essentials of Money and Capital Markets: Fixed Income Markets and Institutions, 4th ed. (San Diego: Cognella, 2020), 3.
Your complete alt text reads:
Short alt text: A line graph.
Long alt text: A title is included at the top of the graph. The x-axis and y-axis include descriptive labels and are split into even increments representing the numerical data. Horizontal grid lines extend from the labeled y-axis across the graph. Two lines plot the points. A key describes the meaning of each line.
Example 2: A Graph Provided for a Data-Driven Purpose
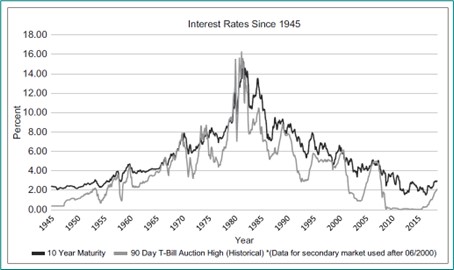
You book includes the following graph. It is a book on finance, and the graph is provided in a chapter that describes how interest rates are calculated. Surrounding text describes and defines 10-year maturity and 90-day T-bill auction. The caption asks students to consider the highest and lowest points for interest rates, and then to reflect on recent years.
Source: Miles B. Livingston, Essentials of Money and Capital Markets: Fixed Income Markets and Institutions, 4th ed. (San Diego: Cognella, 2020), 3.
You could begin your alt text with:
Short alt text: A line graph depicting interest rates between 1945 and 2015.
Long alt text: Data is provided for 10-year maturity and historical 90-day T-bill auction high. Both lines follow roughly the same trends. The lines start low in 1945, at just over 2 percent for 10-year maturity and just over 0 percent for historical 90-day T-bill auction high. They both rise, with a few ups and downs, to a high point in the early 1980s, at just over 14 percent for 10-year maturity and just over 16 percent for historical 90-day T-bill auction high. They both drop, with a few ups and downs, to a low point in the early 2010s, at just under 2 percent for 10-year maturity and just above 0 percent for historical 90-day T-bill auction high. The most recent data is about 3 percent for 10-year maturity and just over 2 percent for historical 90-day T-bill auction high.